How galaxies grow and quench, pixel by pixel
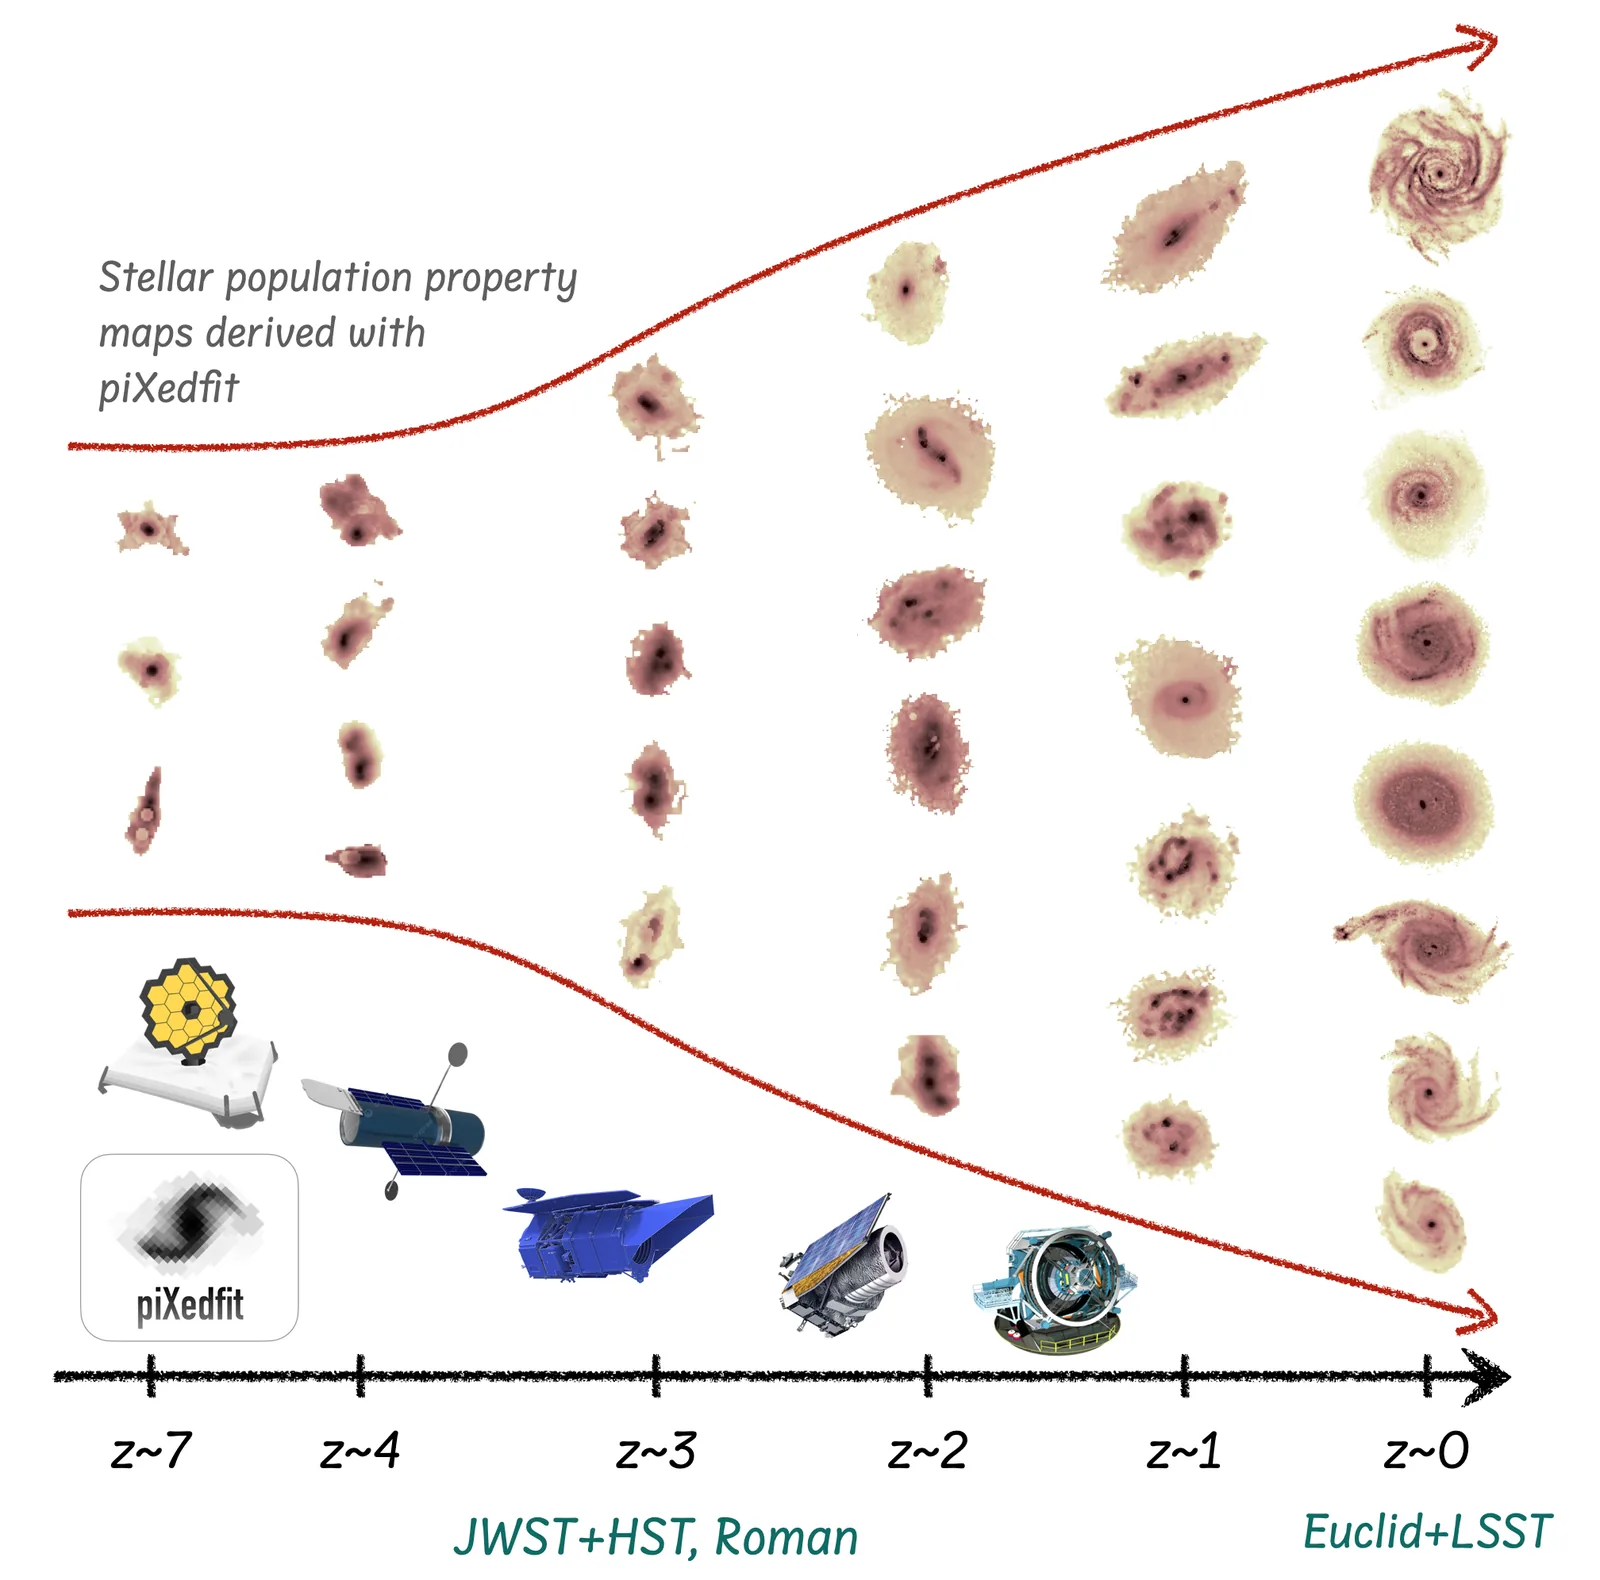
Today’s galaxies range from clumpy disks to compact ellipticals. I map the spatial distribution of stellar mass, star formation, age, metallicity, and dust inside galaxies from the cosmic dawn epoch to the present, to identify which processes build bulges and disks and which ones shut star formation down.
- How do galaxies build their structures over cosmic time?
- When do bulge and disk components form, and how do they evolve?
- When, where, and how did galaxies cease star formation (quenching), and what drives it?
Why spatially resolved?
For decades, galaxy evolution studies relied mostly on integrated galaxy properties. These are powerful, but they average over the places where secular evolution, mergers, low-angular-momentum accretion, disk instabilities, and AGN feedback leave their marks. JWST resolves rest-frame optical structure to ~1 kpc out to z ~ 9, and Euclid will do the same for the nearby Universe over most of the sky. Together they make it possible to trace structural assembly over most of cosmic history.
Inside-out growth and quenching
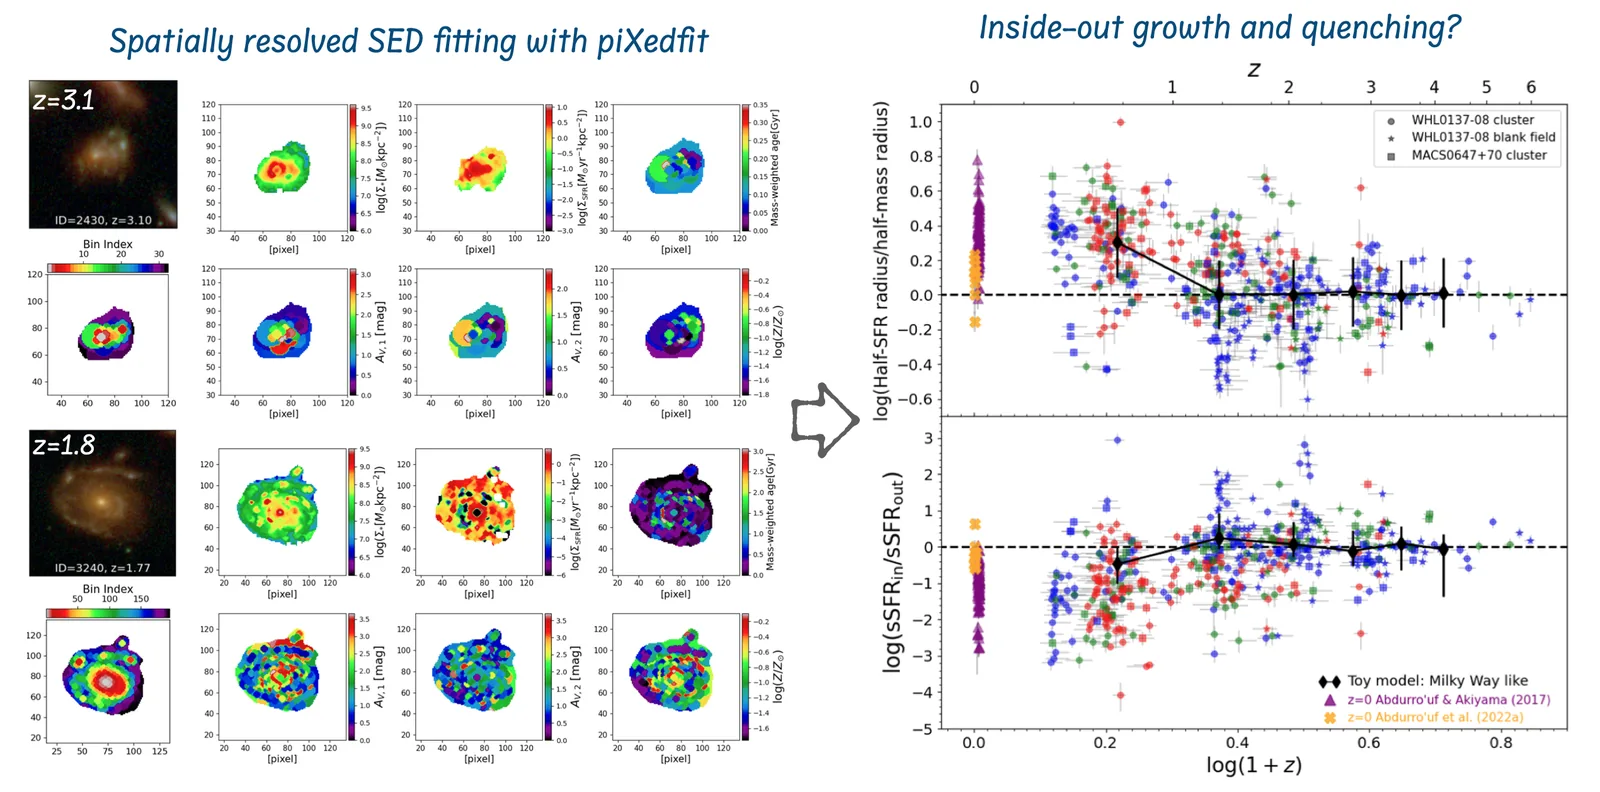
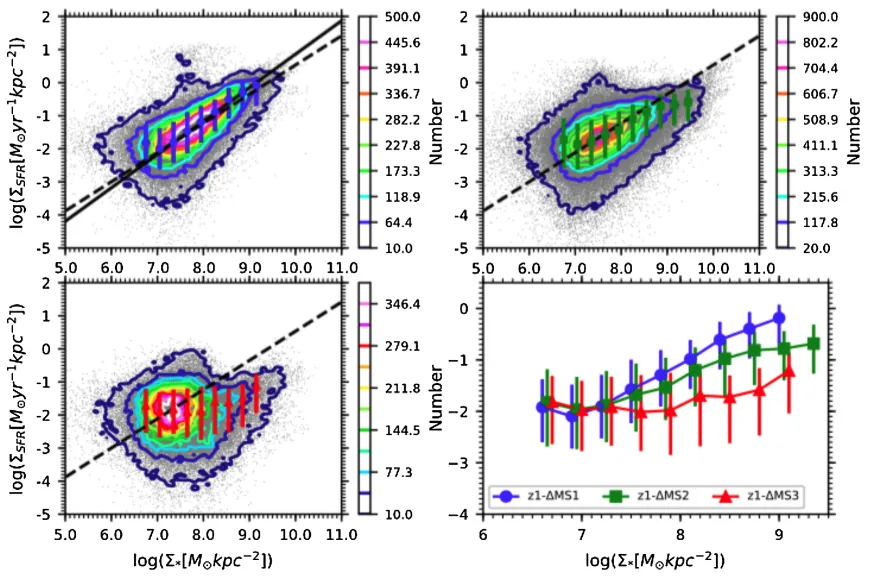
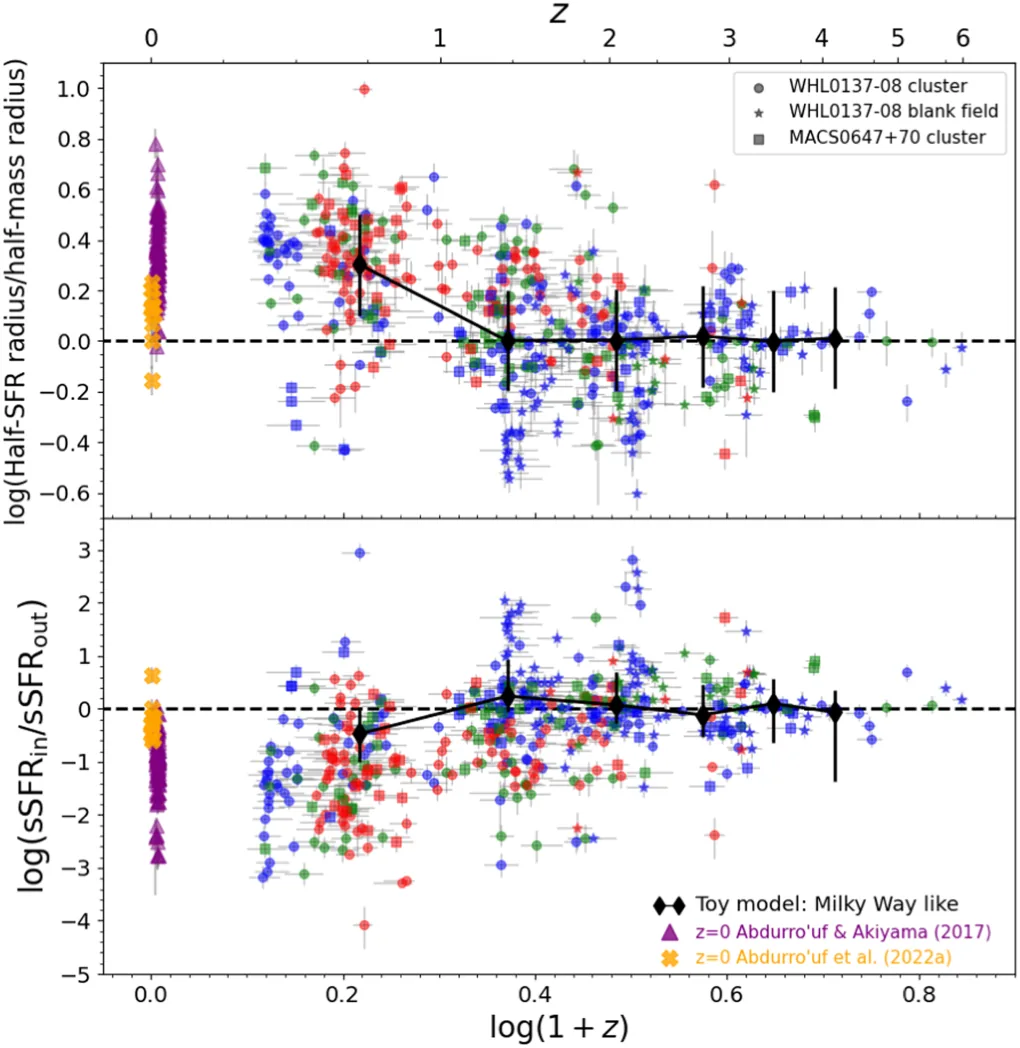
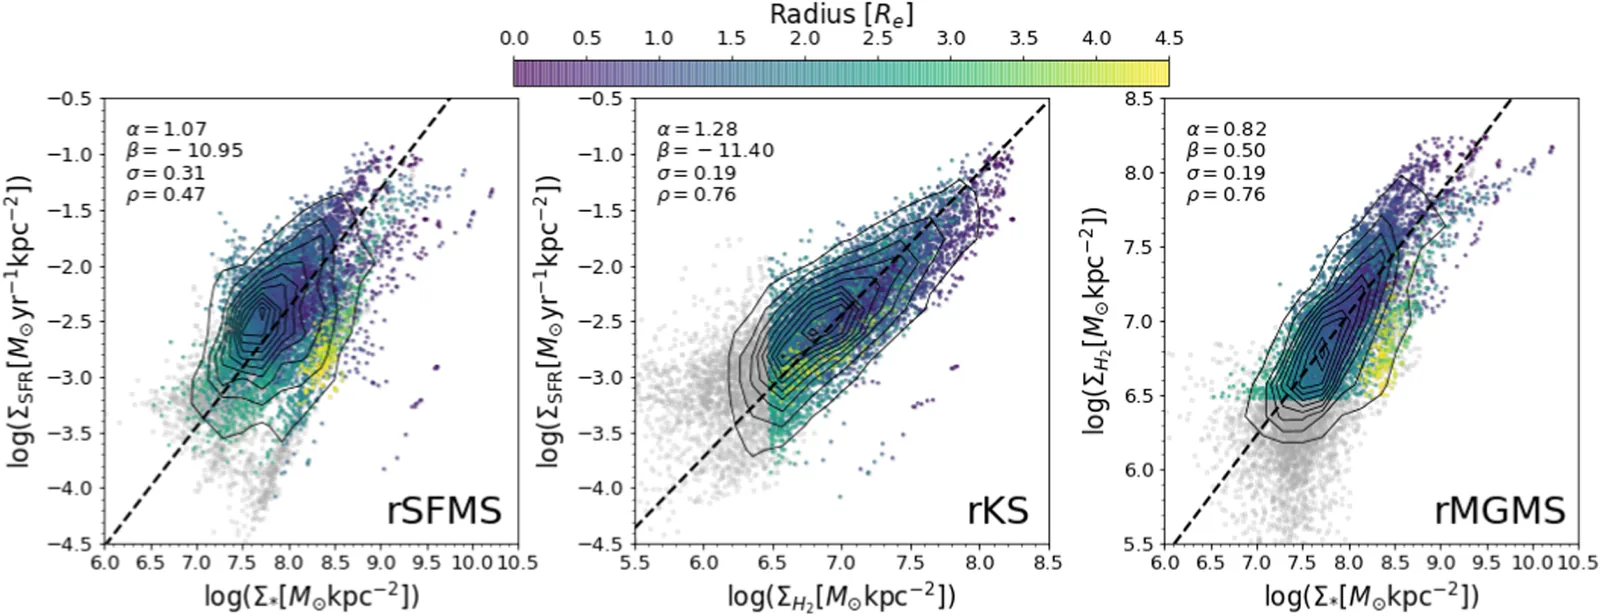
My PhD work found evidence for inside-out stellar mass buildup and quenching in massive disk galaxies at 0 < z < 1, and showed that a spatially resolved star-forming main sequence exists on kiloparsec scales (Abdurro’uf & Akiyama 2017, 2018). With JWST, I extended these measurements to 0.3 < z < 6 in the WHL0137-08 and MACS0647+70 fields and found further support for inside-out growth and quenching (Abdurro’uf et al. 2023).
Stars, dust, and gas in nearby galaxies
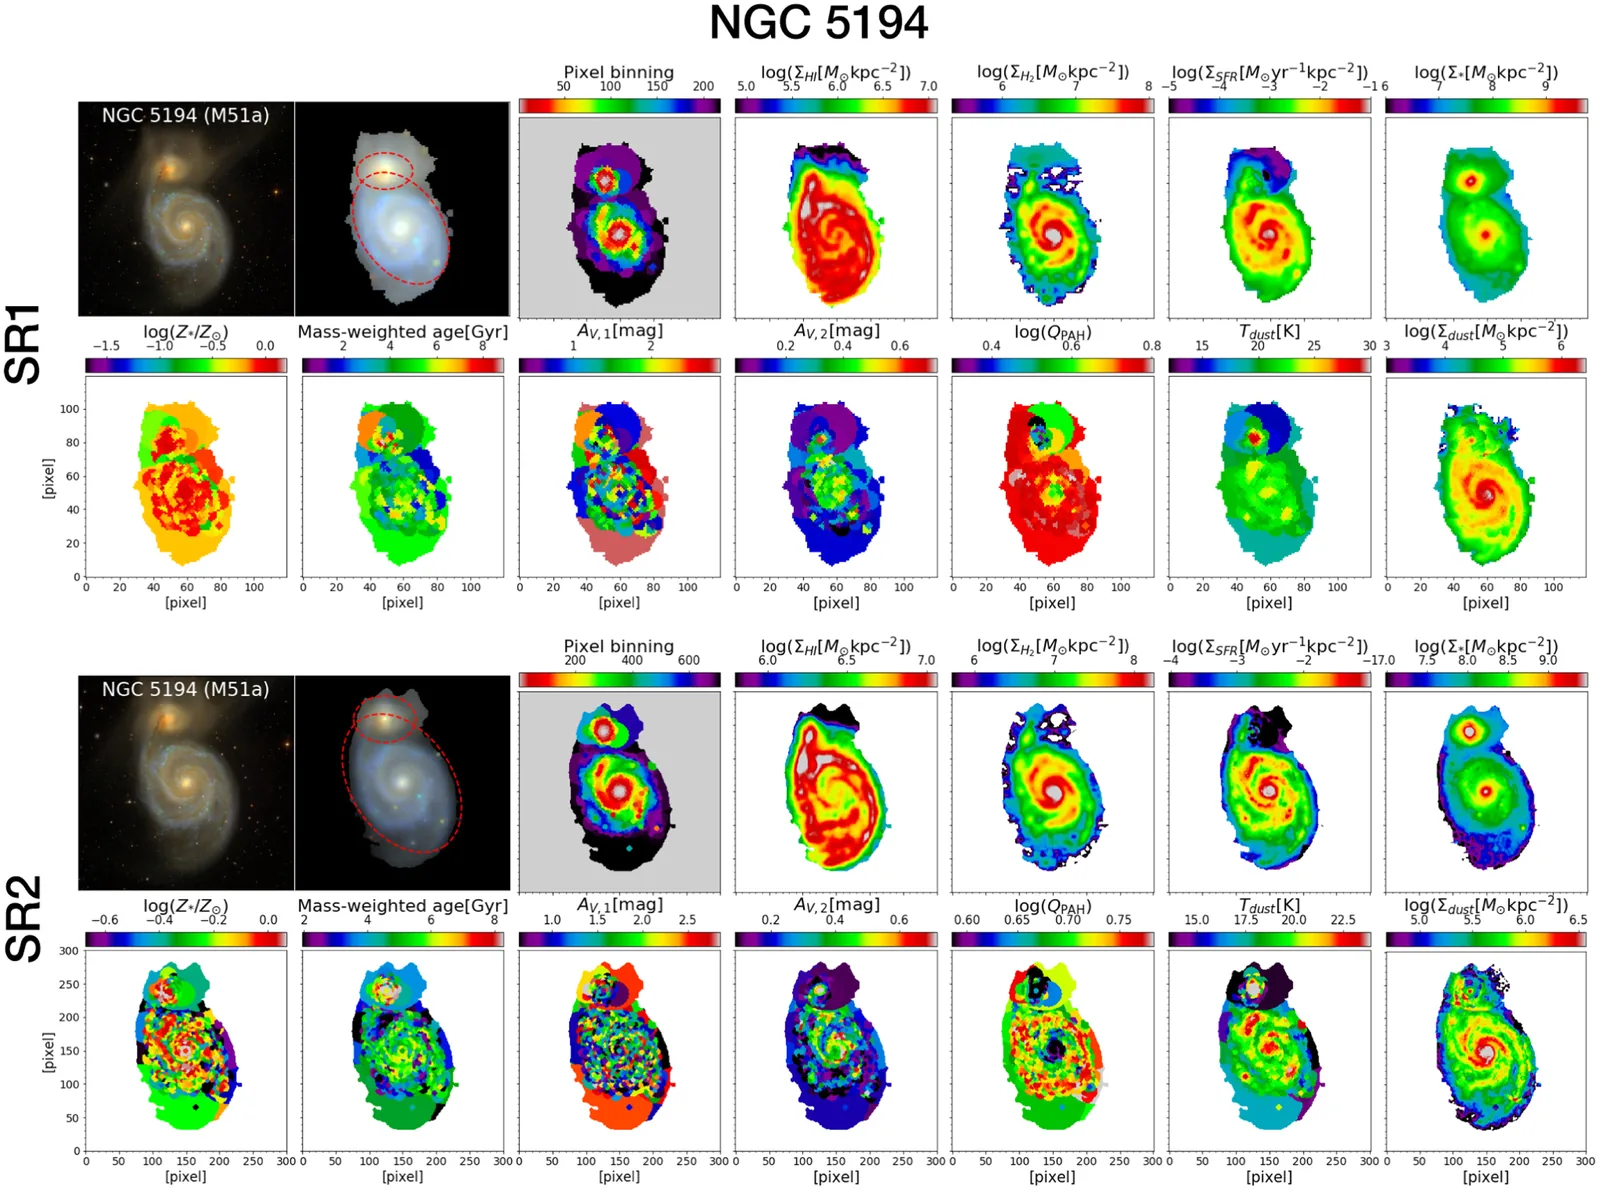
Using more than 20 bands from the FUV to the FIR (GALEX, SDSS, 2MASS, WISE, Spitzer, Herschel) together with atomic and molecular gas maps, I studied how stars, dust, and gas interplay within nearby galaxies. The resulting resolved scaling relations, such as the resolved Kennicutt–Schmidt law and molecular gas main sequence, connect the baryon cycle to the local physical conditions in each region (Abdurro’uf et al. 2022a, 2022c).
Combining JWST imaging and spectroscopy
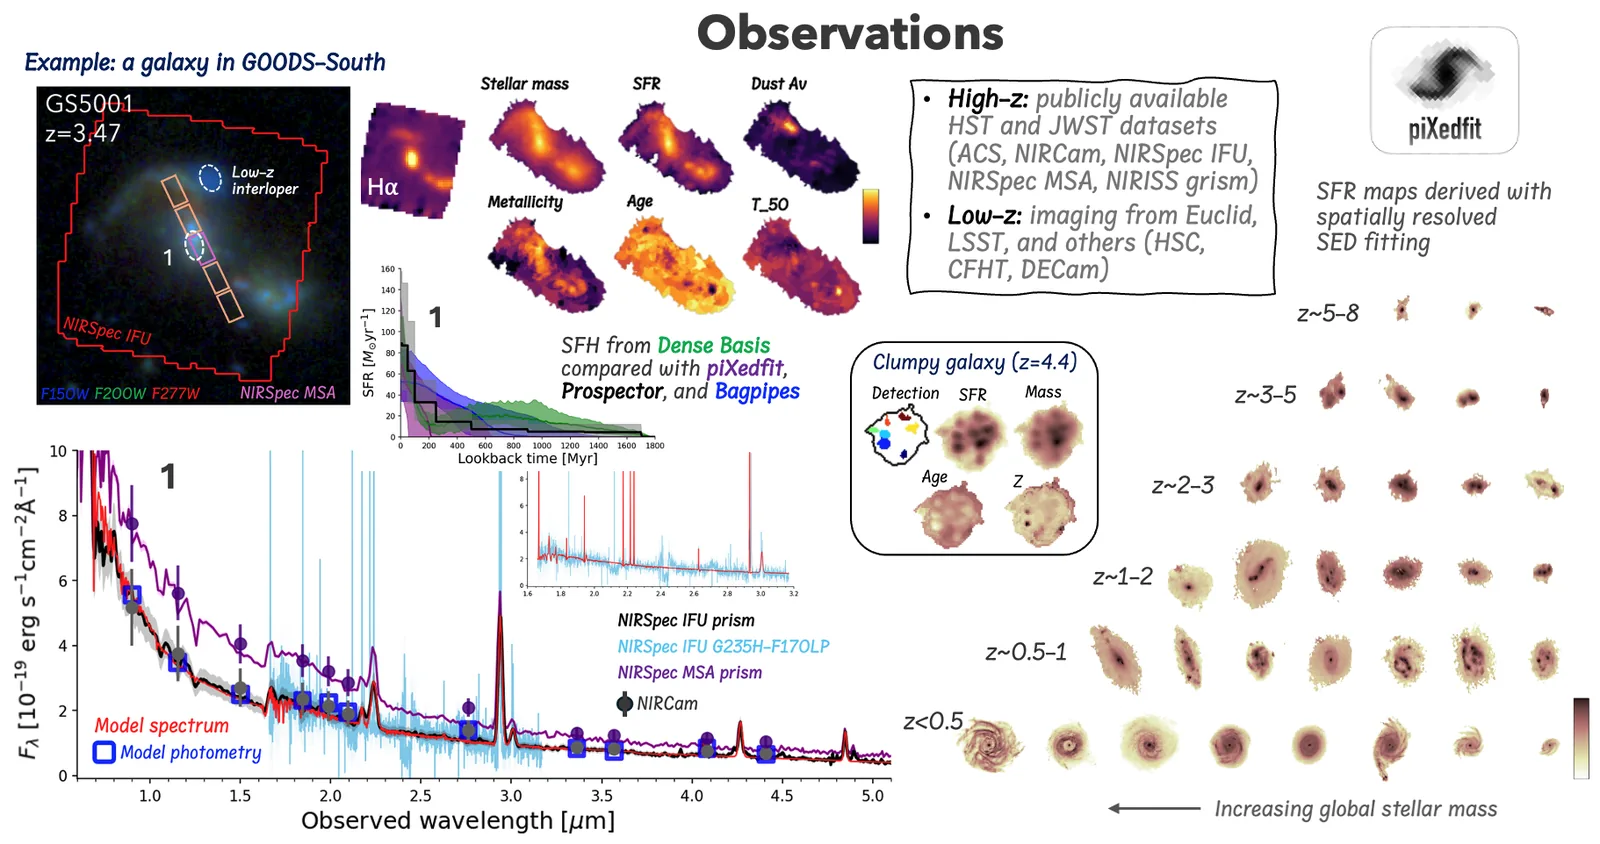
Pairing NIRCam imaging with NIRSpec IFU and MSA spectroscopy gives maps of stellar mass, SFR, dust, metallicity, age, and formation time, with star-formation histories cross-checked across SED codes (piXedfit, Prospector, Bagpipes, Dense Basis). This multi-tracer approach also reveals clumpy galaxies and their individual clumps at z ~ 4.
// what’s next
- Quenching routes across cosmic time: build signature vectors (SFH shape, quenching timescale, Σ1kpc, size, asymmetry, spatial pattern of suppression, environment, AGN) for ~3×10⁵ JWST galaxies at 1.5 < z < 8.
- A resolved census with Euclid and Roman: the radial order of quenching (inside-out vs. outside-in) as a function of halo mass, satellite/central status, and cosmic-web location, plus stellar-population gradients in galaxy outskirts beyond the reach of IFS surveys.
- The relative roles of bulge growth and inside-out disk growth in mass assembly since z ~ 2.